Back in 2006, Pacific Gas & Electric (PG&E) began rolling out 9 million smart meters in Northern California as part of the state’s energy action plan. This initiative was one of the very first efforts to create a “smart grid” by modernizing the grid’s infrastructure through data mining.
Soon after, utilities in many other states also started investing in advanced metering infrastructure (AMI) to take advantage of a new resource in data. Unlike the traditional electric grid which is only capable of sending electricity to consumers, the modern smart grid uses a two-way communication between the utility and electricity consumer, helping utilities gather essential data to balance the supply and demand of energy on the grid.
The grid operator’s main responsibility is to ensure that the energy demand of all their customers is met through energy generated at their power plant. Their objective is to operate the grid as efficiently and at low of a cost as possible, so the surplus energy isn’t produced.
During peak demand, the energy resources are typically limited and utilities often turn to inefficient generator units – peaker plants – to supply extra energy. This results in higher costs to utilities and customers, as well as higher carbon emissions – a lose-lose situation for everyone, including the planet. It is often a goal of utilities to reduce this expense by incentivizing customers to collectively reduce peak energy demand during the day through time-of-use (TOU) rates.
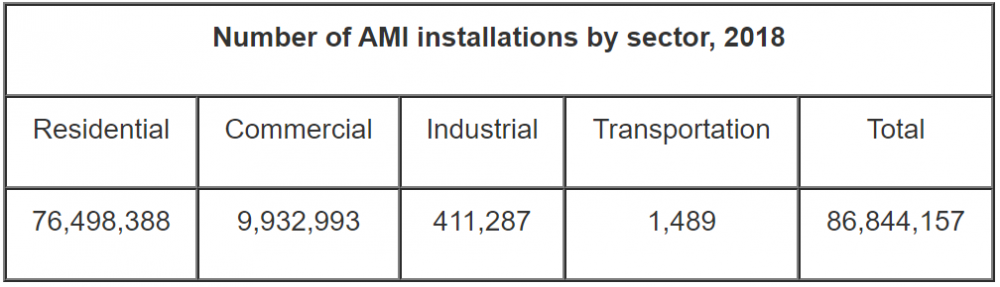
With millions of smart meters deployed all around the US, utilities are generating millions of data points every minute to help them make more cost efficient decisions.
A typical smart meter collects information, such as consumption of energy, voltage levels, current, and power factor. The collection of data would provide appropriate resources that allow utility companies to operate the grid more efficiently and uncover new opportunities to transform the traditional grid into a smart grid that serves millions of users with affordable, reliable, clean energy.
The core value of this data is harnessed through AI and machine learning.
AI and Machine Learning for Time Series Data
There has been significant potential with AI and machine learning in new industrial technologies as researchers have successfully developed and implemented algorithms to build predictive models with different types of data, such as images and voice.
The algorithms behind voice recognition are particularly relevant to the energy industry as energy data is typically structured in a similar sequential manner. Smart meters record relevant data about energy consumption and production in evenly spaced time intervals, providing datasets that could help recognize patterns over time. This is known as time series data.
Traditionally, researchers used a statistical technique called time series analysis to understand the trend of time series data and develop useful forecasting models.
Autoregressive integrated moving average, also known as ARIMA, is a classic linear regression forecasting algorithm that predicts future values based on information extracted from its own lags.
The algorithm accounts for the autoregressive (AR) and moving average (MA) components by determining the number of lags and number of lagged forecast errors as predictors. The integrated (I) component adds differencing to make the time series stationary. The stationarity of the data allows the model to make its predictions utilizing independent variables with the least amount of correlations among one another, thereby improving the prediction accuracy.
ARIMA models are intuitive and easy to understand, but there are limitations due to the nature of linear models.
Energy data often have non-linear relationships depending on the problem, so these often require more sophisticated deep learning models that extract non-linear features for improved forecasting.
Standard neural networks take independent variables as input features and learn optimal parameters for the extracted features through a series of forward propagation and back propagation to maximize performance. The extracted features in the hidden layers help deep learning models predict data with non-linear relationships.
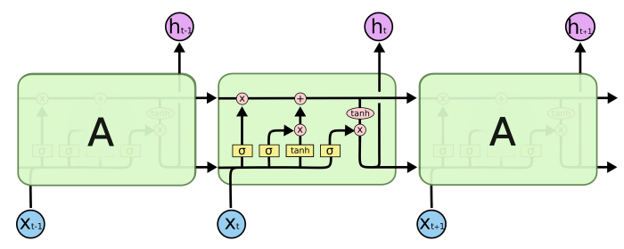
A popular candidate for energy forecasting applications is long short-term memory (LSTM), which uses a recurrent neural network (RNN) architecture.
The biggest advantage of this algorithm is that it can hold onto information from previous timesteps, which helps in learning long-term dependencies. LSTM models are optimized so that important information is retained over a long period of time and non-essential data is dropped through the forget gate.
This deep learning architecture, along with several others, has shown promising results in various energy management applications.
Demand Forecasting for a More Balanced Grid
Utilities are particularly interested in demand forecasting techniques to make sure energy demands of their customers are met at every hour.
Not only do utilities require demand forecasts of energy usage, but they also require information on the various components that contribute to energy production. Renewable energy has a significant effect on the supply and demand of energy on the residential scale through utility scale.
Weather is a significant factor in determining the productivity of renewable infrastructure as a whole.
Solar energy production is determined by the amount of solar irradiance each panel receives from exposure to sunlight, coupled with efficiency due to temperature.
Wind turbines will only generate as much electricity as the wind conditions provide mechanical power. The individual components of weather — including temperature, sunlight, and wind speed — all require their own time series forecasting models.
Solar energy, arguably, has the most dynamic effect on the electric grid operations, making accurate forecasting critical.
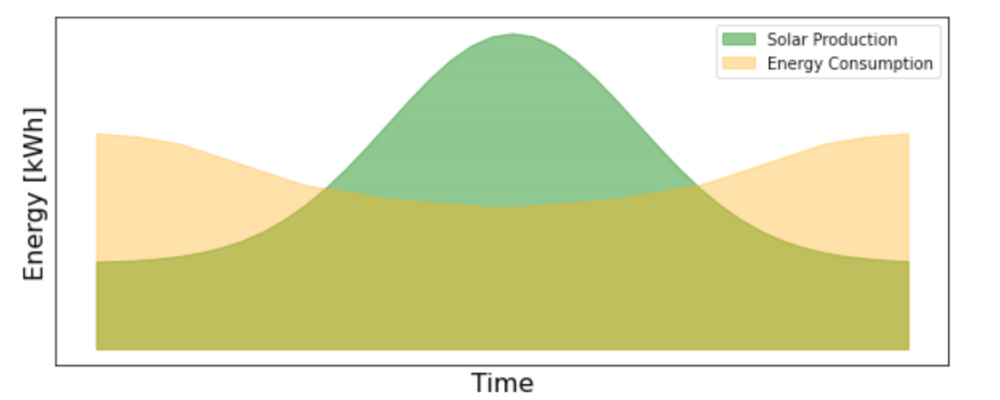
On the residential scale, rooftop solar production forecasting for a single-family home can determine how much grid energy the customers will be drawing and how much excess solar will be put back to the grid.
Consequently, solar energy forecasting for residential properties affects both the supply and demand of energy on the grid. On the utility scale, energy forecasting from solar farms can help optimize a utility company’s energy production so they can efficiently allocate their resources and keep their costs at a minimum by only producing as much fossil fuel energy as is needed.
A Smart Grid Enables Anomaly Detection for Predictive Maintenance
Equipment failure is another concern that has a significant impact on the operations and costs of maintaining the electric grid. Power outages are common when the grid experiences faults, including, but not limited to:
- Short circuits
- Damage to transmission lines
- Damage to fuse or circuit breakers
This is where a smart grid can assist significantly.
Machine learning plays an important role in both the real-time detection of rare events that cause power outages and also in predicting the likelihood of equipment failures.
While natural disasters that damage transmission lines might be more challenging to detect ahead of time, the life cycle of grid equipment due to heavy usage can be more reasonably predicted with enough data.
Grid equipment can often show early signs that deviate from a healthy operational status, without having an immediate effect on the grid operations. However, understanding and identifying these abnormal trends early on can help utility companies save significant amounts of money, while providing customers with better experiences.
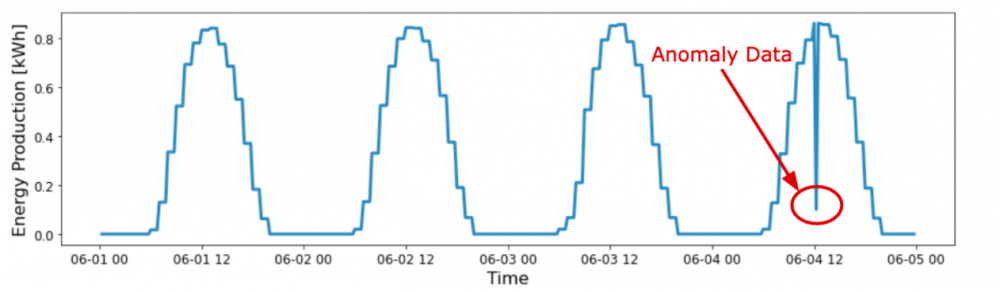
Anomaly detection is a method for identifying rare events or outliers that deviate from the norm of the data set.
For time series data, this usually means the recorded value of a data set is significantly higher or lower than the predicted value from demand forecasting. The outlier metric will vary depending on the problem, but one common approach is to set thresholds that show statistically significant deviations from the median.
If a recorded data point is outside this range, this is an indication of abnormal behavior.
Clustering the data of different grid equipment also helps identify abnormal behavior patterns.
Using unsupervised learning models, utility companies can separate faulty equipment from the rest without prior knowledge of the exact features that indicate equipment failure. This method can help uncover new information that can be applied to build even more accurate models with supervised learning algorithms.
Supervised learning is a different approach that can help classify equipment status with training data. If there are large amounts of data, this can produce very accurate models built with classic machine learning or deep learning algorithms.
However, the general case with utilities that are just starting equipment failure initiatives is insufficient amounts of labeled data. This data can be collected and labeled over time through experiments and proper domain knowledge.
Outlook for a Modernized Smart Grid with AI and Machine Learning
As we move further into the 21st century, there is a dire need to improve the grid operations and infrastructure to meet the energy demands of the growing population in the US and the rest of the world. The aging grid infrastructure will need to be replaced to provide reliable energy to customers with minimal interruption.
Improvements in the existing infrastructure will more than likely be a slow and expensive process, so the utilization of smart meter data with AI and machine learning will be critical to a more efficient operation of the grid in the near future.
A report by the American Council for an Energy-Efficient Economy (ACEEE) in January 2020 showed that most utilities are not taking advantage of the full range of AMI capabilities, including:
- Time of use (TOU) rates
- Real-time energy use feedback for customers
- Behavior-based programs
- Data disaggregation
- Grid-interactive efficient buildings (GEB)
- Conservation voltage reduction (CVR)
Out of 26 utilities with AMI that ACEEE polled, only Portland General Electric in Oregon was utilizing smart meters to their fullest energy-saving capabilities.
Despite this lack of participation by most utilities in energy saving measures, the roll-out of almost 100 million smart meters on the US electric grid has provided a critical piece to the modernization of the grid infrastructure.
Demand response programs have already seen some success with the data provided from the smart meter infrastructure.
In demand response programs, companies change the power consumption of electric utility customers to match the demand with supply from the grid using forecasting models built with AI and machine learning.
Due to the limits of energy generation from the utility side, demand response works with the utility to shave peak energy demand, which reduces the need to run inefficient generating units.
While there have been some improvements in grid operation with data through programs like demand response, there are limitations to what can be done to the grid on the macro-level.
The US electric grid is a seemingly complex system, especially when we consider the integration of renewable resources. Even with AI and machine learning, this becomes a difficult problem since we would have to consider the effects of net metering with renewables generated on-site, as well as the challenges of predicting utility scale renewable energy generation.
The future opportunities with AI and machine learning in grid modernization will likely be more on the micro-level through localized energy usage and production.
When we incorporate time series forecasting and anomaly detection on the microgrid or even nanogrid level, we start to see more reliable and cost efficient solutions that also effectively reduce strain on the electric grid.
At TouchLight, we are working on these very solutions to modernize the grid from the inside out, starting from the nanogrid level. We believe that working with data at the residential level is the most effective way to harness the full potential of AI and machine learning for a more sustainable and resilient grid.